edaplotjs.TimelineHeatmap
Demo: https://yenchiah.github.io/timeline-heatmap/TimelineHeatmap.html
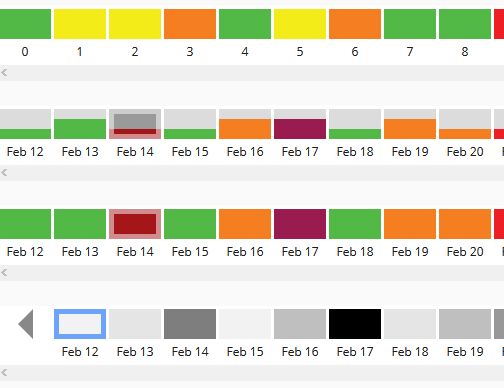
This JavaScript library is for creating an interactive timeline heatmap. Each colored "block" in the timeline represents a time point (e.g. one day). The blocks have differenct labels, colors, and heights (optional), which can encode three different dimensions. It is also possible to store custom dimensions in the DOM elements' data attribute. One example that uses this chart is Smell PGH. In the example, each block means one day, and the color of the blocks represent the concentration of smell reports in that day.
Dependencies
jQuery (necessary, https://jquery.com/)
Usage
First, include the following lines in the <head> tag of html file:
<link href="TimelineHeatmap.css" media="screen" rel="stylesheet" type="text/css"/> <script src="jquery.min.js" type="text/javascript"></script> <script src="TimelineHeatmap.js" type="text/javascript"></script>To create the chart, pass in the DOM container id and settings:
var container_id = "chart-container"; var settings = { data: [["Mar 01", 1, 3, "03/01/2018"], ["Mar 02", 2, 15, "03/02/2018"]], columnNames: ["label", "color", "height", "custom_field"], dataIndexForLabels: 0, dataIndexForColors: 1, dataIndexForHeights: 2 }; fbchart = new edaplotjs.TimelineHeatmap(container_id, settings);The following sections show parameters that you can specify in "settings" and the public methods.
Settings
"data"
The data can be a 2D or 3D matrix, see the "data" field in "TimelineHeatmapData1.json" and "TimelineHeatmapData2.json" for an example.
- If the data matrix is 2D, values will be normalized based on the entire matrix. Columns are variables, and rows are observations. The chart will map the entire color column in the matrix to color codes, and will map the entire height column in the matrix to height of the blocks.
settings["data"] = [["Mar 01", 1, 3, "03/01/2018"], ["Mar 02", 2, 15, "03/02/2018"]];- If the data matrix is 3D, values will be normalized based on each 2D matrix. This allows normalizing values separately (e.g. each 2D matrix represents data in a day). For each 2D matrix, the chart will map its color column to color codes, and will map its height column to height of the blocks.
settings["data"] = [ [["Mar 01", 1, 3, "03/01/2018"], ["Mar 02", 2, 15, "03/02/2018"]], [["Apr 01", 5, 32, "04/01/2018"], ["Apr 02", 4, 55, "04/02/2018"]] ];"columnNames"
This is used for creating data attributes on the DOM element. For example, if the column names are ["label", "color", "height"], for each DOM element, there will be data-label, data-color, and data-height attributes.
settings["columnNames"] = ["label", "color", "height", "custom_field"];"dataIndexForLabels"
The column index in the data matrix for showing labels under each block.
settings["dataIndexForLabels"] = 0;"dataIndexForColors"
The column index in the data matrix for computing the color of each block.
settings["dataIndexForColors"] = 1;"dataIndexForHeights"
The column index in the data matrix for computing the height of each block.
settings["dataIndexForHeights"] = 2;"useColorQuantiles"
By default, the chart maps values to gray scales on each block. Setting this parameter to true will enable rendering each block by color quatiles.
settings["useColorQuantiles"] = true; // use quantile color scale instead of the default linear one"colorBin" and "colorRange"
The bin and range of the color that will be used to render the blocks.
// For color value c: // if c <= 1, use color #dcdcdc // if c > 1 and c <= 10, use color #52b947 // if c > 10, use color #f3ec19 settings["colorBin"] = [1, 10]; settings["colorRange"] = ["#dcdcdc", "#52b947", "#f3ec19"];"noEventWhenColorValueZero"
Prevent adding events to blocks with color value zero.
settings["noEventWhenColorValueZero"] = true // do not add event to a block when its color value is zero"noColorForSelectedBlock"
No color for the selected block (default color is blue).
settings["noColorForSelectedBlock"] = true"heightBin" and "heightRange"
The bin and range of the height that will be used to render the blocks.
// For height value h: // if h <= 10, set the height of the block to 33% of the total height // if h > 10 and h <= 20, set the height of the block to 66% of the total height // if h > 20, set the height of the block to 100% of the total height settings["heightBin"] = [10, 20]; settings["heightRange"] = ["33%", "66%", "100%"];"click"
The callback event when users click on a block.
settings["click"] = function ($e, obj) { console.log("click", $e.data(), obj); };"select"
The callback event when a block is selected after calling public methods.
settings["select"] = function ($e, obj) { console.log("select", $e.data(), obj); };"create"
The callback event when the chart is created.
settings["create"] = function (obj) { console.log("create", obj); };"addLeftArrow"
Add an arrow on the left of the timeline for appending new data. If this setting is a function, when the arrow is clicked, the function will be triggered.
settings["addLeftArrow"] = function (obj) { console.log("Add new data"); var n = obj.getNumberOfBlocks(); obj.prependBlocks([["Mar 03", 9, 2, "03/03/2018"], ["Mar 04", 14, 2, "03/04/2018"]]); obj.clearBlockSelection(); obj.selectBlockByIndex(n); };"leftArrowLabel"
The text on the bottom of the arrow.
settings["leftArrowLabel"] = "More";Public Methods
clearBlockSelection()
Mark the selected block as not selected and reset its style.
fbchart.clearBlockSelection();selectBlockByIndex(index)
Each block has the data-index attribute which is created automatically by the chart. you can call this method to select the block by index. For example, if your data is [["Mar 01", 1, 3, "03/01/2018"], ["Mar 02", 2, 15, "03/02/2018"]], two blocks will be created. Notice that the index is reversed. The index of the last block will always be 0. The index of the first block will be the length of all blocks minus one.
fbchart.selectBlockByIndex(5);selectLastBlock()
Select the last block (the right-most block).
fbchart.selectLastBlock();prependBlocks(data)
Prepend blocks to the left of the timeline.
var data = [["Mar 03", 9, 2, "03/03/2018"], ["Mar 04", 14, 2, "03/04/2018"]]; fbchart.prependBlocks(data);updateBlocks(data)
Remove all current blocks and create a new set of blocks.
var data = [["Mar 03", 9, 2, "03/03/2018"], ["Mar 04", 14, 2, "03/04/2018"]]; fbchart.updateBlocks(data);getSelectedBlockData()
Get the data of the current selected block.
fbchart.getSelectedBlockData();getSelectedBlock()
Get the jQuery DOM element of the current selected block.
fbchart.getSelectedBlock();getNumberOfBlocks()
Get the current number of blocks.
fbchart.getNumberOfBlocks();selectFirstBlock()
Select the first block (the left-most block).
fbchart.selectFirstBlock();getBlockDataByIndex(index)
Use index to get the data for the corresponding block.
fbchart.getBlockDataByIndex(index);getFirstBlockData()
Get the data for the first block (the left-most block).
fbchart.getFirstBlockData();getLastBlockData()
Get the data for the last block (the right-most block).
fbchart.getLastBlockData();hideLeftArrow()
Hide the arrow on the left on the timeline.
fbchart.hideLeftArrow();showLeftArrow()
Show the arrow on the left on the timeline.
fbchart.showLeftArrow();setLeftArrowOpacity(opacity)
Set the opacity of the left arrow and the arrow label.
fbchart.setLeftArrowOpacity(0.5);disableLeftArrow()
Disable the click event of the left arrow.
fbchart.disableLeftArrow();enableLeftArrow()
Enable the click event of the left arrow.
fbchart.enableLeftArrow();