jQuery Click Heatmap Plugin
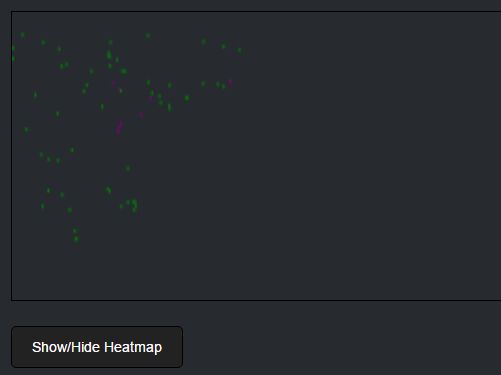
This plugin appends a canvas at the end of the page and displays the user's clicks on the selected element(s) on that canvas.
Installation
You should have npm package manager installed to install this plugin with the following command through your command line interface:
$ npm install jquery-heatmapOr you can download the plugin from the GitHub repo: https://github.com/onatuner/jQuery-heatmap
Or you can download the plugin from NPM's website: https://www.npmjs.com/package/jquery-heatmap
Usage
You can add the heatmap to your HTML page by simply adding the plugin path in a script tag like so:
<script src="js/jquery.heatmap.js"></script>After adding the plugin via the script tag you can use it in your HTML page by adding this between your script tags:
$("h1").heatmapElement();This will create a hidden heatmap of the selected element at the end of the page.
You can use different options to alter the default options to suit your needs as shown below:
$("h1").heatmapElement(); $("h1").heatmapElement({"count": 15}); $("h1").heatmapElement({"disableCount": true}); $("h1").heatmapElement({"disableButton": true}); $("h1").heatmapElement({"refreshSpeed": 1000}); $("h1").heatmapElement({"resize": 1.5});Options
Currently there are 5 configurable options in this plugin. They are:
count: 0, // Sets the starting number for counting disableCount: false, // Enables/disables counting disableButton: false, // Enables/disables the button refreshSpeed: 300, // The refresh speed of the shown count number resize: 1, // Multiplies the heatmap's size with the given valueDemo
You can see a working example of this project here: https://onatuner.github.io/jQuery-heatmap/