sDashboard
A simple & light weight dashboard framework in javascript
##Description
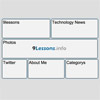
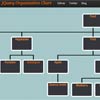
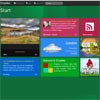
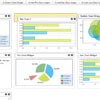
sDashboard is a jQuery plugin that converts an array of objects into a dashboard. Each object in the array would be rendered as a dashboard widget that can be rearranged by dragging around.
sDashboards has built in support for rendering datatable's and flotr2 charts. It also has support to listen for events such as table row click, chart data click and data selection built-in.
##Demo
view an example at : Link to example
##Dependencies
sDashboard depends on the following libraries
- Jquery
- Jquery UI
- Datatables (required for table widgets)
- Flotr2 charts (required for charting widgets)
How to set up
To set up a basic dashboard :
- include the dependent libraries and css files.
<!-- load jquery ui css theme --> <link type="text/css" href="css/jquery-ui.css" rel="stylesheet" /> <!-- load the sDashboard css --> <link href="../sDashboard.css" rel="stylesheet"> <!-- load jquery library --> <script src="libs/jquery/jquery-1.8.2.js" type="text/javascript"></script> <!-- load jquery ui library --> <script src="libs/jquery/jquery-ui.js" type="text/javascript"></script> <!-- load datatables library --> <script src="libs/datatables/jquery.dataTables.js"></script> <!-- load flot charting library --> <script src="libs/float/jquery.flotr2.min.js" type="text/javascript"></script> <!-- load sDashboard library --> <script src="../jquery-sDashboard.js" type="text/javascript"></script> - Create a ul dom element to render the dashboard
<ul id="myDashboard"></ul>- Define a Array of widget definitions
var widgetDefinitions =[ { widgetTitle : "Widget 1" //Title of the widget widgetId: "Widget1" //unique id for the widget widgetContent: "Some Random Content" //content for the widget }, { widgetTitle : "Widget 2" //Title of the widget widgetId: "Widget2" //unique id for the widget widgetContent: "Some Random Content" //content for the widget } ]- call the sDashboard plugin on the ul and pass in the widgetDefinitions by setting the dashboardData options
$("#myDashboard").sDashboard({ dashboardData : widgetDefinitions });##Options for dashboard
dashboardData
An array of objects, where each object is a widget definition.
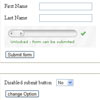
disableSelection
Its an optional parameter, the default value for this property is true, i.e. by default text selection is disabled on all widgets, however if you want to enable text selection, set disableSelection to false.
$("#myDashboard").sDashboard({ dashboardData : widgetDefinitions, disableSelection : false // enables text selection on the dashboard });##Options for widget Definitions
Currently while defining the widget definitions you can use the following options
widgetTitle
Title of the dashboard widget
widgetId
A unique id for the dashboard widget ###widgetType
Type of widget, possible values are : table , chart . When set to table, the widget renders as a data table with default row click event built-in. If its a chart, the widget gets rendered as a flotr2 chart. The chart type depends on the options you pass to the widgetContent.
###getDataBySelection
Default value is false, when set to true, registers a chart selection event instead of chart click on the flotr2 charts. Generally turn on this setting, if you are using a line chart, for ease of selecting chart data.
###setJqueryStyle
Default value is false, but when set to true, the table widget styles the datatable with jquery ui theme
###widgetContent
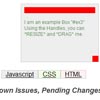
- When using a basic widget, it can represent an string or any html dom element. For example, if a dom element already exists on the page, and you want to render it as a dashboard widget, simply get a hook to the dom element using $("#id") (or any jQuery selector) and pass it to the widgetDefinition by setting it on the widgetContent.
//for simple string set the widget content as $("#myDashboard").sDashboard("addWidget",{ widgetId: "id12345", widgetTitle:"String example", widgetContent:"Some random string, that renders as a widget" }); //for a dom element, set the widget content as $("#myDashboard").sDashboard("addWidget",{ widgetId: "id123456", widgetTitle:"Existing Dom example", widgetContent:$("SomeDomElementID Or Class") }); - if widgetType is set to
chart, thewidgetContentis set as an object with two keys,dataandoptions, a sample setup looks like
var chartData; //flort2 data var charOptions; //flotr2 options $("#myDashboard").sDashboard("addWidget",{ widgetId : "id123", widgetTitle: "Widget Title", widgetType : "chart", widgetContent : { data : chartData, options : chartOptions } }); NOTE: chartData and chartOptions should be constructed based on flotr2 documentation, please see the flotr2 documentation for more details on settings can be found on flotr2 documentation page. You can also refer to the demo example of sDashboard.
- if widgetType is set to
table, it expected to set as :
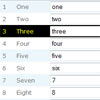
var tableData = { "aaData" : [[0,2],[2,4],[4,6],[6,8]], "aoColumns" : [{ "sTitle" : "Col A" },{ "sTitle: : "Col B" } ] }; $("#myDashboard").sDashboard("addWidget",{ widgetId : "id123", widgetTitle: "Widget Title", widgetType : "table", widgetContent : tableData }); NOTE: aaData, aoColumns and sTitle are datatables specific keywords, please refer to datatable documentation for more details on this.
##Methods
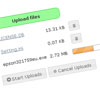
Refreshing a widget
To refresh individual widget you need to specify two new properties to the widget definition
-
enableRefresh: set to true if you want to display refresh button -
refreshCallBack: call back function that gets called when refresh button is clicked. This function supplies widgetId as an argument
These options could be specified at the time of creating a dashboard or while adding widget dynamically.
Here is a example code snippet
$("#myDashboard").sDashboard("addWidget", { widgetTitle : "Bar Chart 2", widgetId : "id005", widgetType : "chart", enableRefresh: true, //set the enableRefresh property to true to display a refresh button on the header //define a refresh callback function that gets triggered when refresh button is clicked refreshCallBack : function(widgetId){ var refreshedData = { data : myExampleData.constructBarChartData(), options : myExampleData.barChartOptions }; return refreshedData; }, widgetContent : { data : myExampleData.barChartData, options : myExampleData.barChartOptions } }); You can see the complete example in ex.html under example folder.
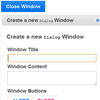
Add a Widget
To add a widget simple call the addWidget method and pass in the widget definition that needs to be added.
$("#myDashboard").sDashboard("addWidget", { widgetTitle : "Widget 7", widgetId : "id77", widgetContent : "Some Content" }); Delete a Widget
To delete a widget simple call the removeWidget method and pass in the widget id that you want to remove from the dashboard
$("#myDashboard").sDashboard("removeWidget", "id7"); ###Get Dashboard Data
To get the array of widget definitions in the current dashboard you can use the getDashboardData api
var arr = $("#myDashboard").sDashboard("getDashboardData"); Alternatively you can also, use the getter on the dashboardData options
var arr = $("#myDashboard").sDashboard("option","dashboardData"); Events
###Table View Row Click
To register for a row click event on a table widget simple set a listener as follows
//table row clicked event example $("#myDashboard").bind("sdashboardrowclicked", function(e, data) { alert("table row clicked"); if (console) { console.log("table row clicked, for widget: " + data.selectedWidgetId); } }); Chart Plot Selection
To register for a plot selection event on a chart widget simply set a listener as follows
//plot selected event example $("#myDashboard").bind("sdashboardplotselected", function(e, data) { alert("plot selected"); if (console) { console.log("chart range selected, for widget: " + data.selectedWidgetId); } });Chart Plot Click
To register for a plot click event on a chart widget simply set a listener as follows
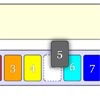
//plot click event example $("#myDashboard").bind("sdashboardplotclicked", function(e, data) { alert("plot clicked"); if (console) { console.log("chart clicked, for widget: " + data.selectedWidgetId); } }); ###Widgets rearranged When widgets are rearranged by dragging around, the sDashboard dispatches a sdashboardorderchanged event. The event carries an array of sortedDefinitions which are stored with a key sortedDefinitions
$("#myDashboard").bind("sdashboardorderchanged", function(e, data) { console.log(data.sortedDefinitions); });###Dashboard creation complete
When the dashboard creation is completed, the sDashboard dispatches a sdashboardcreationcomplete event. Here is a sample code snippet to listen to creation complete event
$("#myDashboard").bind("sdashboardcreationcomplete", function(e) { // your logic goes here }); ###Widget Maximized
When a dasboard widget is maximized, the sDashboard dispatches a sdashboardwidgetmaximized event. This event carries the maximized widget's widget definition object, through which you can get hold of the widget id, widget title and widget content. Here is a sample code snippet for listening to widget maximized event
$("#myDashboard").bind("sdashboardwidgetmaximized", function(e,data) { var widgetDefinition = data.widgetDefinition; }); ###Widget Minimized
When a dasboard widget is minimized, the sDashboard dispatches a sdashboardwidgetminimized event. This event carries the minimized widget's widget definition object, through which you can get hold of the widget id, widget title and widget content. Here is a sample code snippet for listening to widget minimized event
$("#myDashboard").bind("sdashboardwidgetminimized", function(e,data) { var widgetDefinition = data.widgetDefinition; }); ##What's Next
- I am working on implementing features for refreshing individual widgets data and enabling multiple views within a widget, for example, a widget can display a table, bar and pie chart with in it.
- More documentation and bug fixes :D
##Fun Facts
- As you have notices V2.0 is a named release called Salt&Pepper. Just like the way salt and pepper add great flavor to your food, this release adds great flavor and taste to the sDashboard framework :D .In all seriousness, I just felt its easy to remember the version with a name rather than a version number.
##Architectural Changes
One of the major change I've made is to replace flot charts with flotr2 library, I ve been researching many charting libraries and I strongly feel that flotr2 is the best charting library in terms of the features and ease of use it provides. Hence I went forward with using this library for sDashboard.
##Credits
Special thanks to the following project which are a great source of inspiration for the sDashboard framework.
###Flex dashboards
sDashboard is heavily inspired from flex dashboard framework, more details flex dashboard can be found at: link
###Flotr2 Charts
sDashboard uses Flotr2 charts to render charts within widgets, more details about flotr2 charts can be found at link
Datatables
sDashboard uses datatables library to render table grids, more details about datatables can be found at link
Jquery & JQuery UI
Few portions for sDashboard look and feel have been inspired from the following example on the jQuery UI project pages
###Other References
- DocumentUp library is used to generate the project page for this library, more detail about document up can be found at: link
##Change Log
- Current version V2.0
##Features
The current version of the dashboard includes the following features
current
Current version : V2.2 (aka AMDfying)
- Added support to load the library in an AMD setup.
- Added an example with bootstrap style.
Previous version's :
V2.0.1
- Added support for listening to dashboard creation complete event.
- Added support for listening to widget maximized or widget minimized events.
V2.0 (aka Salt&Pepper)
- Full support for all Flort2 charts.
- Support for chart click and selection
- Support to listen for widget rearrangement and get the rearranged widget definitions array
- Improvements to maximize feature on widgets, Widgets can now maximize to full screen
- Source code for the library reduce by 15% when compared to previous code ( I know this is a show off :D)
- Re- architectured the way we render charts to support more type of charts instead of sticking to bar, pie and line.
- Added example to render an existing dom element as a dashboard widget (see the twitter widget on the demo page)
V1.0
- Drag and rearrange widgets
- Maximizing & Minimizing a widget
- Close Widgets
- Rendering data table with in widget
- Rendering Bar/Pie/Donut/Line charts (deprecated)
- Ability to click through table rows
- Ability to click on chart data
- Ability to select chart data
- Adding a widget dynamically
- Removing a widget dynamically
- Jquery UI themeroller support
##Licence
The MIT License (MIT)
Copyright (c) 2012 Model N, Inc
Permission is hereby granted, free of charge, to any person obtaining a copy of this software and associated documentation files (the "Software"), to deal in the Software without restriction, including without limitation the rights to use, copy, modify, merge, publish, distribute, sublicense, and/or sell copies of the Software, and to permit persons to whom the Software is furnished to do so, subject to the following conditions:
The above copyright notice and this permission notice shall be included in all copies or substantial portions of the Software.
THE SOFTWARE IS PROVIDED "AS IS", WITHOUT WARRANTY OF ANY KIND, EXPRESS OR IMPLIED, INCLUDING BUT NOT LIMITED TO THE WARRANTIES OF MERCHANTABILITY, FITNESS FOR A PARTICULAR PURPOSE AND NONINFRINGEMENT. IN NO EVENT SHALL THE AUTHORS OR COPYRIGHT HOLDERS BE LIABLE FOR ANY CLAIM, DAMAGES OR OTHER LIABILITY, WHETHER IN AN ACTION OF CONTRACT, TORT OR OTHERWISE, ARISING FROM, OUT OF OR IN CONNECTION WITH THE SOFTWARE OR THE USE OR OTHER DEALINGS IN THE SOFTWARE.