
A plugin for adding charts to Vue


Table of Contents
Purpose
This plugin is designed to allow Vue.js developers to incorporate fully reactive and customizable charts into their applications. The plugin is built off of the D3.js JavaScript library for manipulating documents based on data. By binding data from your components, you can create complex charts and graphs that respond to changes in your application. Vue.js lifecycle events will trigger the charts to update and maintain two-way binding between your charts and your data. By adding in a state management (such as Vuex) you can additionally persist state across an entire application.
V Chart Plugin is built using Vue.js' component architecture. This will allow the chart to be a first class citizen of your Vue.js application. Combining multiple charts allows you to create complex dashboards and enable deeper insights into your data. All aspects of the charts can be configured to allow for full customization of your graphs along with the ability to style the SVG elements using the classes and IDs generated for each individual canvas element.
By adding additional charts into the import folder and importing them into the v-chart-plugin.js you can include any custom charts to use with Vue.js. Using the JavaScript API you can hook into the specific methods in the API and create a reusable component that can persist across your application.
Usage
These instructions are assuming you are using Vue CLI to create your template. Include the plugin in your main.js:
import Chart from 'v-chart-plugin' Vue.use(Chart);Within your component you will need to include an object with: title, selector, width, height, and datapoints to pass to the component. Data can be passed as an array or as an array of objects:
export default { name: 'example', data () { return { chartData: { chartType: 'barChart', selector: 'chart', title: 'Important Data', width: 300, height: 200, data: [120, 140, 70, 90, 110, 65, 210] } } } }If passed as an array of objects you will need to define which attribute to use as your metric / dimension
export default { name: 'example', data () { return { chartData: { chartType: "vBarChart", selector: "chart", title: "Important Data", width: 400, height: 200, metric: 'count', // for two or more metrics pass as an array ['count', 'pyCount'] data: [ {'count': 120, 'fruit': 'apples'}, {'count': 250, 'fruit': 'oranges'} ] } } } }Bubble Charts require three metrics (v1, v2, and v3). These should be passed as metrics
export default { name: 'example', data () { return { chartData: { chartType: "bubbleChart", selector: "chart", title: "Important Data", width: 400, height: 200, metric: ['count', 'pyCount', 'revenue'] data: [ {'count': 120, 'pyCount': 115, 'revenue': 170, 'fruit': 'apples'}, {'count': 250, 'pyCount': 255, 'revenue': 325, 'fruit': 'oranges'} ] } } } }Overrides
If you need to override any of the default values of the charts (pallette colors, ticks, margins, etc) you can pass an overrides object to you chartData.
vBarChartData: { chartType: "vBarChart", ... overrides: { palette: { fill: 'red', }, y: { ticks: 20, }, } },Legends
Legends are turned off by default. You can add a legend to a chart by including a legends objects in your chartData as such:
chartData: { chartType: "vBarChart", ... legends: { enabled: true, height: 25, width: 50, } }Gridlines
Gridlines are turned off by default. You can include and configure your gridlines via the configuration object:
chartData: { chartType: "barChart", ... grid: { enabled: true, gridTicks: 25, } }Goals
Goals are used to place a line on your graph showing where your target is for the period:
chartData: { chartType: "lineGraph", ... goal: 500, }Labels
Labels are assigned to the x and y axis:
chartData: { chartType: "lineGraph", ... label: true, }Chart types currently supported:
- barChart: a chart in which the numerical values of variables are represented by the width of rectangles of equal height.
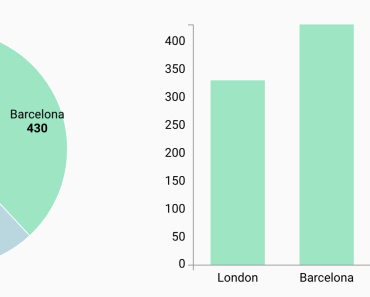
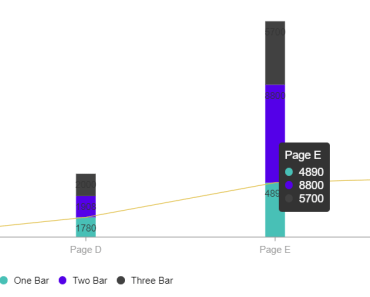
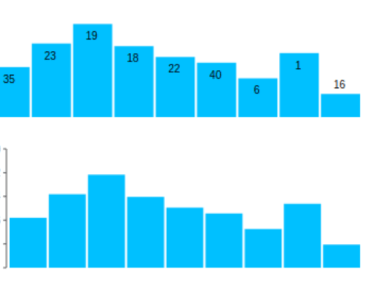
- vBarChart: a chart in which the numerical values of variables are represented by the height of rectangles of equal width.
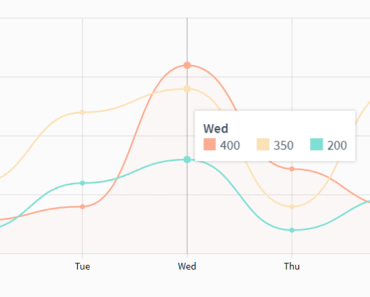
- lineGraph: a graph which displays information as a series of data points called 'markers' connected by straight line segments.
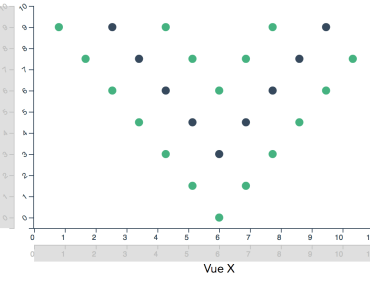
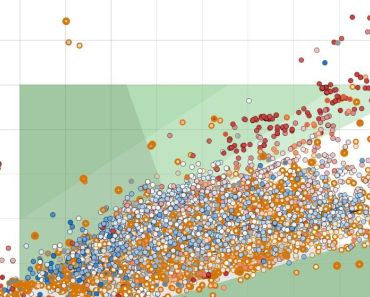
- scatterPlot: a graph in which the values of two variables are plotted along two axes, the pattern of the resulting points revealing any correlation present.
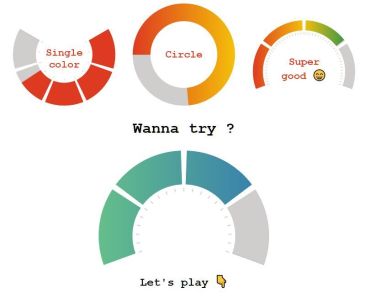
- pieChart: a chart in which a circle is divided into slices to illustrate proportion
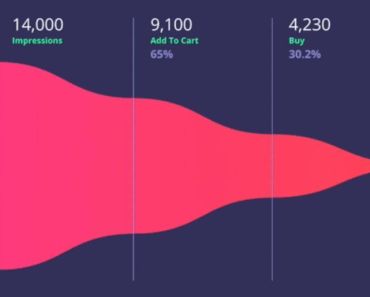
- areaChart: a chart which displays graphically quantitative data
- bubleChart: a bubble chart is a variation of a scatter chart in which the data points are replaced with bubbles, and an additional dimension of the data is represented in the size of the bubbles.
Charts that support two or more metrics
- barChart
- vBarChart
- lineGraph
Lastly you will need to add the component and bind your data
<v-chart v-bind:chartData="chartData"></v-chart> If you wish to style the components of the chart you can via the selectors:
<style> .chart-barChart { fill:blue; } </style>Performance Consideration
By default all charts are imported into v-chart-plugin.js. This allows all charts to share one common interface. If you are only using a few select charts in your implementation you can remove those unused charts from the import statements in the v-chart-plugin.js.
import barChart from './import/barChart' import vBarChart from './import/vBarChart' import lineGraph from './import/lineGraph' import scatterPlot from './import/scatterPlot' import pieChart from './import/pieChart' import areaChart from './import/areaChart'Build Setup
# install dependencies npm install # serve with hot reload at localhost:8080 npm run dev # run test scripts npm run test # build for production with minification npm run build # build for production and view the bundle analyzer report npm run build --report # build module npm run compile For a detailed explanation on how things work, check out the guide and docs for vue-loader.