MigrationsMap.net
This is the code of the site http://migrationsmap.net, including the scripts used to generate the JSON data files.
The code is under MIT license.
Don't hesitate to contact me at [email protected], or via twitter: http://twitter.com/madewulf if you have any question.
Data Generation Process
The map has been generated using four data sources:
- A csv file: global_migrant_origin_database_version_4.csv, containing all the migrations number from country to country. It is really just a matrix of country-to-country migrations number, addressable by country code.
- world.json, a geojson file containing the borders data of all countries in the world, addressable by the countries full English name
- The world bank data, which provide indicators, like AIDS prevalence, for every country in the world, addressable by year and country code.
- The google geolocation API, to find out the "central" coordinates of a country (the point to which arrows will be pointing when pointing to a country)
Here is the process used to generate the json data files used by the map:
-
Run functions (mainly, geolocalize_the_world and load_matrices) from parser.py, which, from global_migrant_origin_database_version_4.csv (provided), will generate two files:
- code_to_name.json: a json object allowing to find the full English name of a country corresponding to a country code in ISO 639 format (ex: BEL -> Belgium)
- geoloc.json: a json object containing the dump of all geolocalization requests sent to Google. Beware, since Google was not able to geolocalize correctly some name (for example, Georgia result is the US state, not the Country), the file has been edited manually a bit, and rerunning the function will reintroduce the errors.
-
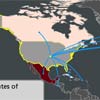
Run arrowcomputer2.py, which, from the matrixes of migrations data generated by parser.py from the csv file and the coordinates in geoloc.json, will generate two file per country in the 'generated' directory. Those file contains ten svg paths, one per "arrow" to be drawn on the map when clicking on the country, each one associated with the corresponding migrations number. There are two files per country: one for the incoming migrants and the other for the outgoing migrants, called for example for the USA: inUSA.json and outUSA.json. Arrowcomputer2.py also generates in the process the file code_to_coordinates.json, which is a json object/dictionary allowing to find for each country code, the corresponding central coordinates. (the map size specified in geojsontosvg.py is used to compute the size and positioning of the arrows).
-
Run geojsontosvg.py, which, from world.json and a map size (specified directly in the file), will generate the file world_svg_paths.json, which is a json object allowing to get, for each full English country name , the borders in as svg paths. The projection is an equirectangular one (if I understood correctly).
-
Run associate_map_to_db.py, which is a lousy interactive script allowing to solve the problem of the full English country names that are not matching exactly in the data coming from the csv files and the world.json file. For example, Myanmar is referred as Burma in one of the file and United States is not an exact match for United States of America. This script will generate the file reconciliation.json, which matches the problematic country names with the corresponding country code.
-
Run jsoncsvunifier.py which, from world_sv_paths.json and reconciliation.json will generate the final borders-as-svg file : world_svg_paths_by_code.json, which is a json object allowing to get, for each country code, the borders in as svg paths.
-
Run worlBankDataGetter.py (I know, I should definitely enhance my file naming conventions), to download the indicators data from the world bank api and store them in json files : GDP per capita (GDP.json), mortality under five (UNDER-FIVE-MORTALITY.json), tuberculosis prevalence (TUBERCULOSIS.json), HIV prevalence (HIV.json) and population size (POP.json)
To run those python scripts, you will need to install the python Requests library first.