


sgvizler2
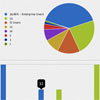
Sgvizler2 is a javascript wrapper for easy visualisation of SPARQL result sets (and a jQuery plugin). See the demo (in the menu "tutorial", there are examples) and the typedoc.
This project is the reboot in Typescript of project Sgvizler of Martin G. Skjæveland.
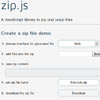
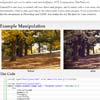
Add visualisations directly into your webpages like this:
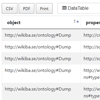
<div id="result" data-sgvizler-endpoint="https://query.wikidata.org/sparql" data-sgvizler-chart="bordercloud.visualization.DataTable" data-sgvizler-query=" PREFIX rdfs: &lt;http://www.w3.org/2000/01/rdf-schema#&gt; SELECT * WHERE { ?object ?property ?valueOrObject . } LIMIT 4 " ></div> <script src="sgvizler2/sgvizler2.js"></script> <!--script src="node_modules/sgvizler2/build/browser/sgvizler2.js"></script--> <script> //Draw a chart //sgvizler2.containerDraw('result'); //or //$("#result").containerchart(); //Draw all Chart sgvizler2.containerDrawAll(); </script>Generate your chart with our SPARQL editor and to read their docs.
Download directly Sgvizler2
The path of Sgvizler2 will be :
<script src="sgvizler2/sgvizler2.js"></script>Install the package via yarn or npm
With yarn or npm
yarn add sgvizler2 # or npm install sgvizler2 The path of Sgvizler2 will be :
<script src="node_modules/sgvizler2/build/browser/sgvizler2.js"></script>Get started
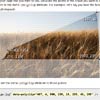
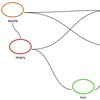
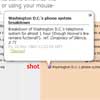
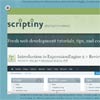
You can use the SPARQL editor to generate an example with your SPARQL query and see examples for each charts, maps and tables in this project.
Why reboot the project ?
The project could not be easily extensible and the docs was not automatically generate in the packages for composer, yarn, npm, etc. The project can exist without Google and new libs of charts exist. For example with D3JS,...
And why with Typescript ? The project is now too complex and there are hard problems to debug with several charts of Google. I search solutions... but finally, I have to reboot with the start project typescript. It's possible to generate a compatible lib in Javascript with unit test and coverage of code. So... There are only a problem with JSDoc that not support several token of Typescript. I try TypeDoc but it do not generate tutorials like JSDoc :( The JSDoc of project generates only tutorials for the moment.
If you want to participate at this project, read this doc.