Majuro.js
Majuro.js is an open data platform. In each city, users select a neighborhood or draw a custom area to extract buildings. They then can color-code, annotate, and describe each building, before creating a static site by forking the repo and adding their JSON data through Github's web interface.
The objective is to develop custom maps based on cities' public data, without leaving the web browser or introducing command line tools.
Code for interactive maps, the maps server, and homepage are all open source.
How to create your project
Step 1: Select your city on MajuroJS.org.
Step 2: Draw a polygon around your neighborhood.

Step 3: Click the "Web Map" link to load buildings into an interactive map editor.
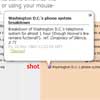
Step 4: Interact with any building to add a photo, description, or color-coding.


How to share your map
You have three options to share your finished map:
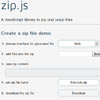
Option 1: Download your map as KML (for Google Earth) or GeoJSON.

Option 2: Save to MajuroJS.org A link in the map sidebar saves your map "in the cloud" and gives you a shareable link.
Visitors to your map can download it in KML (for Google Earth) and GeoJSON formats.
Option 3: Store on Github Pages Download your map as a GeoJSON file. Then fork this repo to your Github account - creating an account is free!
While you're signed into Github and on github.com/USERNAME/majurojs, click on mybuild.geojson. Then click "Edit" above the text box to make it editable. Paste in the GeoJSON from your own map. If you're not sure how to copy the GeoJSON file, open it in Notepad (Windows) or TextEdit (Mac).
Your map will appear at USERNAME.github.io/majurojs.
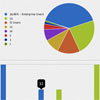
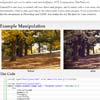
Visualizations
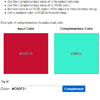
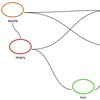
Map Key
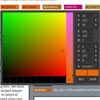
You can add a map key to show what red, blue, green, and orange buildings symbolize on your map.
After forking this repo to your Github account, click on mapkey.js and then Edit to make the map key appear, add symbols, and change any other settings.
3D View
Rendering 3D buildings with D3.js and three.js is an option for users of Firefox, Chrome, and Opera. Adapted from Brian Mount's original 3D GeoJSON map.

A 3D View is available directly from the neighborhood-drawing map on MajuroJS.org, or at USERNAME.github.io/majurojs/3d after you fork this repo.
Customization: Put your buildings data into mybuild.geojson.
Tips: Use arrow keys to pan, < and > to zoom, d and x to tilt, z and s to roll.
Neighborhood Editor
A mini map editor will appear at USERNAME.github.io/majurojs/editor after you fork this repo.
Customization: Put your buildings data into mybuild.geojson.
Downloads: Users of Firefox, Chrome, Opera, and IE10+ can work with your map and add details, then download Google Earth / KML or GeoJSON files. They won't be able to save their changes on your site.
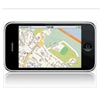
Google Maps Demo
A Google Maps API view will be set up at USERNAME.github.io/majurojs/gmaps after you fork this repo.
Customization: Put your buildings data into mybuild.geojson.
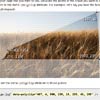
Fisheye Map
The fisheye map visualization wraps buildings around the center of the map based on logarithmic distance. It will be set up at USERNAME.github.io/majurojs/logarithmic after you fork this repo.
Customization: Put your buildings data into mybuild.geojson, and add ?center=LATITUDE,LONGITUDE to the end of the URL to change the center of the map.
Direct API
Send a direct request for buildings in KML or GeoJSON format by sending an array of [lng, lat] coordinates in a URL:
/timeline-at/[ [ lng1, lat1 ], [lng2, lat2], [lng3, lat3]... ] /timeline-at/[ [ lng1, lat1 ], [lng2, lat2], [lng3, lat3]... ].geojson /timeline-at/[ [ lng1, lat1 ], [lng2, lat2], [lng3, lat3]... ].kml Specifying a source can speed up your query. These follow the URL format of /draw. For example, if /draw/allegheny is valid, then allegheny is the source name.
/timeline-at/SOURCE/[ [ lng1, lat1 ], [lng2, lat2], [lng3, lat3]... ] /timeline-at/SOURCE/[ [ lng1, lat1 ], [lng2, lat2], [lng3, lat3]... ].geojson /timeline-at/SOURCE/[ [ lng1, lat1 ], [lng2, lat2], [lng3, lat3]... ].kml Client-side libraries
- Leaflet.js by Cloudmade https://github.com/Leaflet/Leaflet
- Leaflet.Pancontrol by Kartena https://github.com/kartena/Leaflet.Pancontrol
- Leaflet zoomByAbout by Michael Evans https://gist.github.com/4487402
- jQuery (1.7.1) http://jquery.com
- Bootstrap http://twitter.github.com/bootstrap/
Server-side technologies
Custom neighborhood datasets are generated by a modified GeoData Checkout, using a node.js server and MongoDB database.
KML and JSON downloads are provided with HTML5 BlobBuilder and FileSaver APIs, or by Eli Grey's BlobBuilder.js and FileSaver.js.
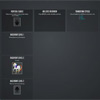
About Poang
Poang (github) is a Node.js/MongoDB app built using the Express framework. Poang uses Everyauth for local authentication, Mongoose-Auth to connect Everyauth to MongoDB (and Mongoose as the ODM) for account persistence, and Connect-Mongo as a session store. Most of the code in app.js was generated by Express and all of the code in auth.js after the Comment schema is straight from the Mongoose-Auth docs.
For testing, Poang uses the Mocha test framework, should for assertions, Sinon.JS for mocks & stubs, and Zombie.js for lightweight integration testing.
For more details, please see BeyondFog's blog post that walks through the various tests in Poang.
About MongoDB
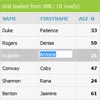
MongoDB is a NoSQL database which supports geospatial queries. The drawn polygon is saved as a CustomGeo, and its points are used to make this query:
timepoint.TimePoint.find( { ll: { "$within": { "$polygon": poly } } }) Server Setup
-
Do a git clone:
git clone git://github.com/mapmeld/majurojs.git
-
cd into the project directory and then install the necessary node modules:
npm install -d
-
start up MongoDB if it's not already running:
mongod --noprealloc --nojournal
-
start the node process:
node app.js
-
add a geospatial index to the "ll" field in your MongoDB settings
Deploying to Heroku
heroku create APP_NAME git push heroku master After you have created a new app on Heroku and pushed the code via git, you will need to use the Heroku Toolbelt from your command line to add the free MongoLab starter addon:
heroku addons:add mongolab:starter Go to Heroku, click on Apps and then on this app's Addons. On the MongoLab admin panel, make sure there is a geospatial index to the "ll" field
Uploading data
POST each of your polygons to /timeline using a script such as savannahbuild.py (included in the master branch of the repo).
The POST body should include these variables:
- lat = center latitude
- lng = center longitude
- points = vertices in string with format lng1|lat1||lng2|lat2
Include these variables to add details and/or timespan information:
- name
- address
- start (milliseconds in Unix time)
- startyr (years AD)
- end (milliseconds in Unix time)
License
Majuro.js is available through the open source MIT license.
Third-party libraries such as jQuery, Bootstrap, and Poang are made available under their respective licenses.