jquery-highchartsmaker
jQuery plugin to generate highcharts by reading a table
Usage
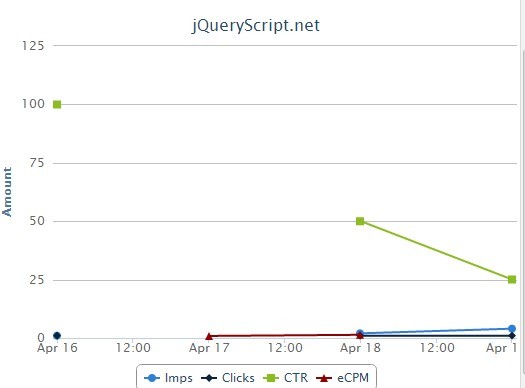
Consider this table
| Date | Imps | Clicks | CTR | eCPM |
|---|---|---|---|---|
| Apr 16, 2012 | 1 | 1 | 100% | |
| Apr 18, 2012 | 2 | 1 | 50% | $0.88 |
| Apr 19, 2012 | 4 | 1 | 25% | $1.37 |
<div id="chart"></div> <!-- You will need to create a target element for where the chart will go --> <table id="data"> <thead> <tr> <th>Date</th> <th>Imps</th> <th>Clicks</th> <th>CTR</th> <th>eCPM</th> </tr> </thead> <tbody> <tr> <td>Apr 16, 2012</td> <td>1</td> <td>1</td> <td>100%</td> <td></td> </tr> <tr> <td>Apr 18, 2012</td> <td>2</td> <td>1</td> <td>50%</td> <td>$0.88</td> </tr> <tr> <td>Apr 19, 2012</td> <td>4</td> <td>1</td> <td>25%</td> <td>$1.37</td> </tr> </tbody> </table>Call highchartsmaker plugin on the target element (in this case, the element ID 'chart')
$('#chart').highchartsMaker($(#data), { // Options (or pass empty object for no special options) "yAxis":{ "min":0 }, "date_interval":86400000, "title":"Example Chart" });Result


