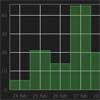
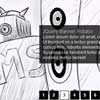
 Here is a very simple way ho to create a heat map with jQuery. The idea is to track the clicks of a user and then display the click pattern with semi-transparent dots on an overlay. You can try out the demo by first clicking around on the page and then clicking “Analyze”. Since the dots are semi-transparent, spots that have been clicked on more often, will appear slightly darker. Click on the overlay to make it invisible again and continue with the “recording”.
You May Also Like


jQuery Plugins
- 3D Slider
- AutoComplete
- Barcode
- Blur Effect
- Calculator
- Captcha
- Checkbox
- Color Picker
- Confirm Dialog
- Context Menu
- Cookies
- Countdown Timer
- Coverflow
- Currency Format
- DateTime Picker
- Dialog
- Editable
- Event Calendar
- File Upload
- Filter
- Fixed Header
- Flipbook
- Form Submit
- Form Validation
- Form Wizard
- Fullscreen
- Geolocation
- Grid
- History
- Html5 Audio Player
- HTML5 canvas
- Html5 Local Storage
- Html5 Video Player
- Image Crop
- Image Hover Effect
- Lazy Load
- Login
- Mask
- Mega Menu
- MultiSelect
- News Ticker
- Notification
- Parallax
- Placeholder
- Portfolio
- Preloader
- Progress Bar
- Range Slider
- Rating
- Rotate Image
- Scrollbar
- Scrolling Effects
- SelectBox
- Shopping Cart
- Side Menu
- Social Share
- Sorting
- Timeline
- Tooltip
- Treeview
- Video Background
- Weather
- Website Tour
- Wysiwyg Editor
- YouTube
AngularJs Plugins
- Accordion
- Animation
- Application
- Autocomplete
- Bootstrap
- Calendar
- Carousel
- Chart_Graph
- Date_Time
- Drag_Drop
- Forms
- Gallery
- Maps
- Menu_Navigation
- Modal_Popup
- Plugins
- Premium
- Slider
- Table
- Tabs
- Text Effects
- Tutorials
- Video_Audio
- Zoom