jQuery-radar-graph
Create a customizable radar graph with minimal code.
DEMO / JSFIDDLE: https://jsfiddle.net/ewvxonj3/
Normal version or .min available.
Step 1: Link the radarGraph.js file:
<script type="text/javascript" src="FILEPATH/TO/radarGraph.js"></script> Link to a separate js file: (Optional)
<script type="text/javascript" src="FILEPATH/TO/ANOTHER/JSFILE.js"></script> Or add script tags:
<script></script> Step 2: create a canvas element with an ID in an html file:
<canvas id="canvas1">This text would show if browser does not support canvas.</canvas> Step 3: Inside your custom js file or inside the script tags add the following at a minimun to test:
$(document).ready(function (){ $('#canvas1').radarGraph(); }); This should display an example graph to confirm that it works.
Step 4: To customize the graph to your needs, create an object to pass to the plug in.
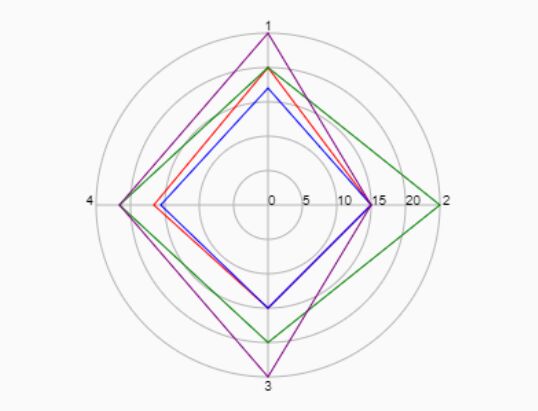
// create obj var obj = { // fill the shapes drawn or not default = false /boolean polyfill: false // how much indent margin you want around graph default = 25 int borderOffset: 25, // how many lines will be drawn on graph: default = 4 int dataPoints: 4, // how many rings will be drawn default = 5 int levels: 5, // maximum score to be used default = 25 int maxValue: 25, // array labels for the data points, default array length = 4 labels: [ 'data point 1', 'data point 2', 'data point 3', 'data point 4', ] // object using numbered indexes for each person/ criteria you are graphing chartData: { // name = what you want to graph, // score = an array of ints with a length equal to the dataPoints, default = 4, // color = color that will be used for each obj index {'0':{'name':'person1', 'score':[20,15,15,16.6],'color':'red'} } };