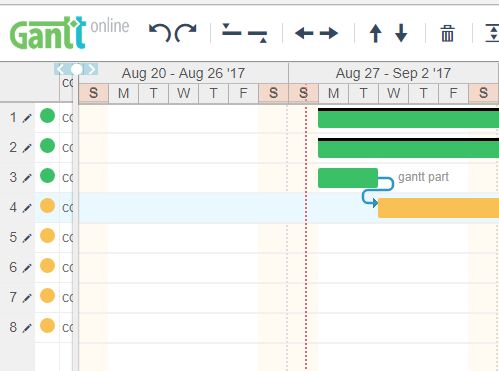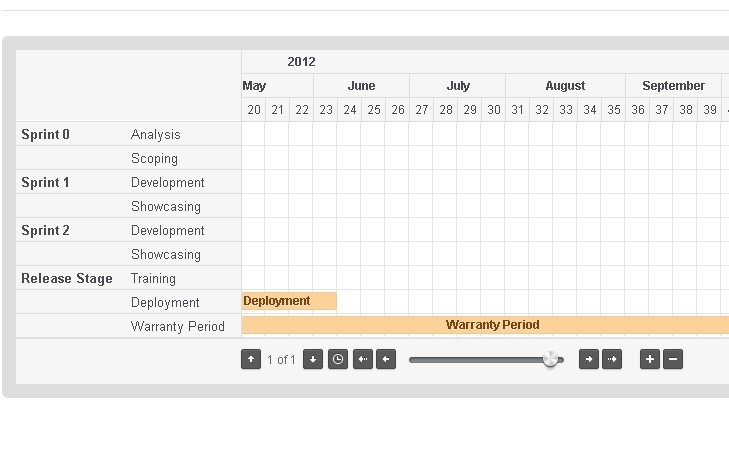
jQuery-ganttChart
ganttChart is a plugin for jQuery built around ease of use. It supports the customization and use of frameworks like Bootstrap.
Documentation and demo
Everything you need to know can be found here: https://e-systemes.github.io/jquery-ganttChart/
Getting started
Requirements
The plugin requires the ImprovedDate object. You can download the last release here
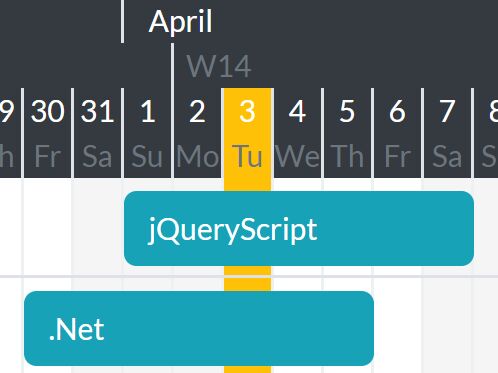
Events
Events are objects displayed in the chart with the following properties:
- startDate: a Date object
- endDate: a Date object
- title: a string displayed in the event
- url: an optional string wich transforms the event title into a link
- style: an optional string to add a css class to the event ( see theming below )
In your html:
<!-- include jquery.ganttChart CSS --> <link rel="stylesheet" href="css/jquery.ganttChart-min.css"> <!-- ganttChart wrapper --> <div id="ganttChart"></div> <!-- Add required improvedDate --> <script src="js/jquery.improvedDate.min.js"></script> <!-- Add jquery.ganttChart plugin --> <script src="js/jquery.ganttChart.min.js"></script> In your javaScript:
// instanciate the gantt chart $('#ganttChart').ganttChart( { startDate: new Date(), // the starting date of the chart endDate: new Date(), // the ending date of the chart events: [ // Array of the events { startDate: new Date(), // the starting date of the event endDate: new Date(), // the ending date of the event title: 'string', // title of the event url: 'string', // optional - link the event to an url style: 'string' // optional - class for styling the event } ] } ); Tranlation
You can use the lang option to translate month and day names.
Theming
Customize jquery.ganttChart plugin with our template options for global style preferences for easy theming and component changes.
- Show / hide components of the chart's header
- Sizing cells and events
- Styling the chart's components
Licence
Copyright ©2018 Lionel Astol
Licensed under the MIT license.