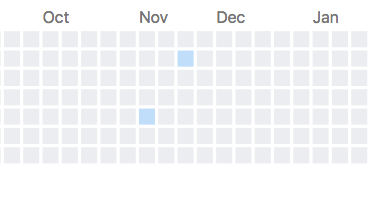
vue-calendar-heatmap


A lightweight calendar heatmap Vuejs component built on SVG, inspired by github's contribution calendar graph. With vertical mode, tooltip powered by v-tooltip.
Table of contents
Installation
npm install --save vue-calendar-heatmap Default import
Global Install:
import Vue from 'vue' import VueCalendarHeatmap from 'vue-calendar-heatmap' Vue.use(VueCalendarHeatmap)Use specific components:
import Vue from 'vue' import { CalendarHeatmap } from 'vue-calendar-heatmap' Vue.component('calendarHeatmap', CalendarHeatmap)or in a parent components .vue file
<script> import { CalendarHeatmap } from 'vue-calendar-heatmap' export default { components: { CalendarHeatmap }, // ... } </script>Distribution import
Global Install:
import 'vue-calendar-heatmap/dist/vue-calendar-heatmap.css' import VueCalendarHeatmap from 'vue-calendar-heatmap/dist/vue-calendar-heatmap.common' Vue.use(VueCalendarHeatmap)Use specific components:
import 'vue-calendar-heatmap/dist/vue-calendar-heatmap.css' import { CalendarHeatmap } from 'vue-calendar-heatmap/dist/vue-calendar-heatmap.common' Vue.component('calendarHeatmap', CalendarHeatmap)Browser
<link rel="stylesheet" href="vue-calendar-heatmap/dist/vue-calendar-heatmap.css"/> <script src="vue.js"></script> <script src="vue-calendar-heatmap/dist/vue-calendar-heatmap.browser.js"></script>The plugin should be auto-installed. If not, you can install it manually with the instructions below.
Install all the components:
Vue.use(VueCalendarHeatmap)Use specific components:
Vue.component('calendarHeatmap', VueCalendarHeatmap.CalendarHeatmap)Usage
Availables props
values - values - required
Array of objects with date and count keys. date values can be a date parseable string, a millisecond timestamp, or a Date object. count value should be a number.
<calendar-heatmap :values="[{ date: '2018-9-22', count: 6 }, ...]" ... />endDate - end-date - required
Can be a date parseable string, a millisecond timestamp, or a Date object. The calendar will start automatically one year before this date.
<calendar-heatmap :end-date="2018-9-22" ... />colorRange - color-range
Array of 6 strings which represents the colors of the progression.
- The color at
colorRange[0]will always represent the values for acount: null - The color at
colorRange[1]will always represent the values for acount: 0 - The others are automatically distributed over the maximum value of count, unless you specify
maxprops.
Default value is equal to the example.
<calendar-heatmap :range-color="['ebedf0', 'dae2ef', '#c0ddf9', '#73b3f3', '#3886e1', '#17459e']" ... />max - max
Any number which should be the max color.
<calendar-heatmap :max="10" ... />noDataText - no-data-text
Tooltip text to display on days without data. null by default (shows no tooltip at all).
<calendar-heatmap :no-data-text="no data for this day" ... />tooltip - tooltip
Boolean for enable/disable tooltip on square hover. true by default.
<calendar-heatmap :tooltip="false" ... />tooltipUnit - tooltip-unit
String representing heatmap's unit of measure. Value is "contributions" by default.
<calendar-heatmap tooltip-unit="stars" ... />vertical - vertical
Boolean to switch to vertical mode. false by default.
<calendar-heatmap :vertical="true" ... />